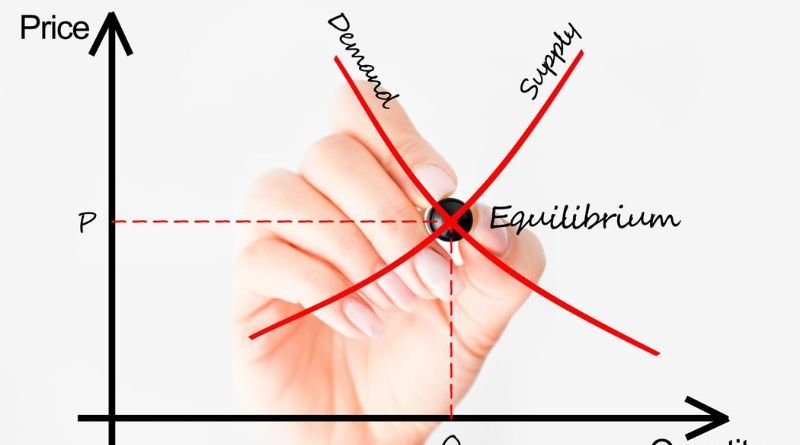
The demand curve is a fundamental concept in economics that illustrates the relationship between the price of a good or service and the quantity demanded by consumers. It serves as a visual representation of how changes in price influence consumer purchasing behavior. In this article, we will explore the demand curve, its components, and its significance in market analysis, along with some frequently asked questions.
Table of Contents
What is a Demand Curve?
A demand curve is typically represented as a downward-sloping line on a graph where the x-axis represents the quantity of a good demanded, and the y-axis represents its price. The downward slope indicates the law of demand: as the price of a good decreases, the quantity demanded increases, and vice versa.
Key Components of a Demand Curve
- Price: This is the amount consumers are willing to pay for a good or service. Prices can vary due to market conditions, consumer preferences, and availability of substitutes.
- Quantity Demanded: This refers to the total amount of a good or service that consumers are willing and able to purchase at a given price during a specific time period.
- Axes: The horizontal axis (x-axis) represents the quantity demanded, while the vertical axis (y-axis) represents the price of the good.
Types of Demand Curves
There are two main types of demand curves:
- Individual Demand Curve: This curve represents the demand of a single consumer for a particular good or service. It highlights how that individual’s purchasing decisions change with varying prices.
- Market Demand Curve: This curve aggregates the demand from all consumers in the market for a particular good or service. It is derived by summing the individual demand curves of all consumers.
Factors Influencing the Demand Curve
Several factors can cause the demand curve to shift, either to the right (increase in demand) or to the left (decrease in demand):
- Consumer Income: As income increases, consumers are generally able to purchase more goods and services, shifting the demand curve to the right. Conversely, if income decreases, the demand curve shifts left.
- Consumer Preferences: Changes in tastes and preferences can lead to increased or decreased demand. For example, if a product becomes trendy, demand will increase.
- Price of Related Goods: The demand for a good can be affected by the price changes of substitutes (goods that can replace each other) or complements (goods that are used together). If the price of a substitute increases, demand for the original good may rise, shifting the curve to the right.
- Population Changes: An increase in the population typically leads to a higher demand for goods and services, shifting the demand curve to the right.
- Expectations: If consumers expect prices to rise in the future, they may purchase more now, increasing current demand. If they expect prices to fall, they may wait, reducing current demand.
Importance of the Demand Curve in Economics
Understanding the demand curve is crucial for various stakeholders:
- Businesses: Companies analyze the demand curve to set optimal pricing strategies, forecast sales, and make production decisions.
- Policy Makers: Governments use demand curves to evaluate the impact of taxation, subsidies, and regulation on consumer behavior and market outcomes.
- Economists: The demand curve is a vital tool for economic modeling and predicting how changes in economic variables will affect market dynamics.
Graphing a Demand Curve
To graph a demand curve, you need data on the price and quantity demanded at different levels. Here’s how to do it:
- Collect Data: Gather data showing various prices and the corresponding quantity demanded.
- Plot Points: On a graph, plot the points where the x-axis represents quantity and the y-axis represents price.
- Draw the Curve: Connect the points with a smooth downward-sloping line to create the demand curve.
FAQs About the Demand Curve
1. What does a shift in the demand curve indicate?
A shift in the demand curve indicates a change in demand due to factors other than price, such as changes in consumer income, preferences, or the prices of related goods.
2. What is the difference between a change in quantity demanded and a change in demand?
A change in quantity demanded refers to movements along the demand curve due to price changes, while a change in demand refers to shifts in the entire curve due to external factors.
3. How do you calculate the elasticity of demand?
The price elasticity of demand is calculated by the formula:
[ \text{Elasticity} = \frac{\text{Percentage change in quantity demanded}}{\text{Percentage change in price}} ]
This measures how responsive quantity demanded is to a change in price.
4. Can the demand curve ever be upward-sloping?
Yes, in certain cases, such as Giffen goods or Veblen goods, the demand curve can be upward-sloping. Giffen goods are inferior goods for which demand increases as the price rises, while Veblen goods are luxury items for which higher prices may increase demand due to perceived prestige.
5. How do seasonal trends affect the demand curve?
Seasonal trends can lead to temporary shifts in the demand curve. For example, demand for winter clothing typically increases in colder months, shifting the demand curve to the right.
Conclusion
The demand curve is a fundamental concept in economics that provides valuable insights into consumer behavior and market dynamics. By understanding how demand curves work and the factors that influence them, businesses, policymakers, and economists can make informed decisions that impact the economy. As the marketplace continues to evolve, the demand curve remains an essential tool for analyzing and predicting consumer demand.


